
By Jed Dixon, Co Editor-in-Chief
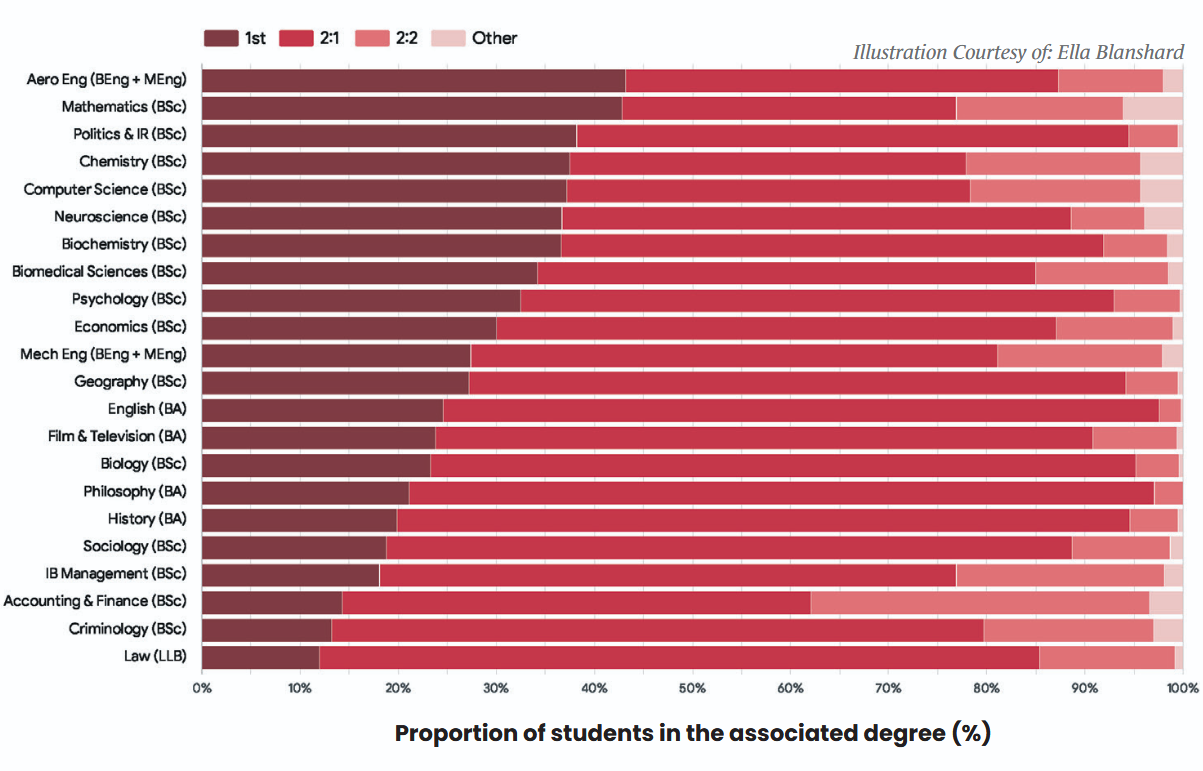
Data obtained via a freedom of information request from the University of Bristol reveals the average grade attainment by course from 2021/22 to 2025/26.
| Course | Graduates | First | 2:1 | 2:2 | Other |
|---|---|---|---|---|---|
| Law (LLB) | 1,957 | 12.0% | 73.4% | 13.8% | 0.8% |
| History (BA) | 982 | 19.9% | 74.7% | 4.9% | 0.5% |
| Economics (BSc) | 975 | 30.0% | 57.1% | 11.9% | 1.0% |
| English (BA) | 818 | 24.6% | 73.0% | 2.2% | 0.2% |
| Psychology (BSc) | 806 | 32.5% | 60.5% | 6.7% | 0.3% |
| Geography (BSc) | 758 | 27.2% | 67.0% | 5.3% | 0.5% |
| Biology (BSc) | 712 | 23.3% | 71.9% | 4.4% | 0.4% |
| Mechanical Engineering (BEng + MEng) | 683 | 27.4% | 53.7% | 16.8% | 2.1% |
| Mathematics (BSc) | 646 | 42.8% | 34.1% | 17.0% | 6.1% |
| Aerospace Engineering (BEng + MEng) | 586 | 43.2% | 44.1% | 10.7% | 2.0% |
| Politics & International Relations (BSc) | 574 | 38.2% | 56.3% | 5.0% | 0.5% |
| Biomedical Sciences (BSc) | 503 | 34.2% | 50.8% | 13.5% | 1.5% |
| International Business Management (BSc) | 453 | 18.1% | 58.8% | 21.2% | 1.9% |
| Computer Science (BSc) | 408 | 37.2% | 41.1% | 17.4% | 4.3% |
| Film and Television (BA) | 391 | 23.8% | 67.0% | 8.6% | 0.6% |
| Accounting and Finance (BSc) | 377 | 14.3% | 47.8% | 34.5% | 3.4% |
| Neuroscience (BSc) | 341 | 36.7% | 51.9% | 7.5% | 3.9% |
| Chemistry (BSc) | 315 | 37.5% | 40.4% | 17.8% | 4.3% |
| Philosophy (BA) | 308 | 21.1% | 76.0% | 2.9% | 0.0% |
| Sociology (BSc) | 288 | 18.8% | 69.9% | 10.0% | 1.3% |
| Criminology (BSc) | 287 | 13.2% | 66.5% | 17.3% | 3.0% |
| Biochemistry (BSc) | 282 | 36.6% | 55.3% | 6.5% | 1.6% |
The above table shows the percentage of students who received a first, 2:1, 2:2 or any other result (3rd, aegrotat, ordinary).
Given the highly varied nature of teaching style, assessment style, and intended outcome of courses a variety of attainment percentages across subjects is to be expected.
The data as presented does not mean that any one course is harder or more valuable than any other, but instead provides students with a useful metric for understanding the differences between courses.
These differences are not unique to the University of Bristol. The Office for Students, which regulates universities in England, directly references ‘subject of study’ as a key variable impacting how they regulate degree classification attainment across the country.
So, variance in results by course is an intended feature of university examinations, but it nonetheless remains interesting to consider the manner in which this materialises across different subjects.
 Juniper Gardner

 Cara Hene

Integrated master’s courses were not included in the majority of the dataset when calculating the above percentages due to the higher grade requirements of these courses. However, since the majority of engineering students take MEng courses, the data for engineering courses contains integrated master’s.
Since the university does not release exact counts of less than five, there are pieces of data missing at points. In these cases it cannot be known if one, two, three or four students achieved a particular outcome. Therefore, most of the figures produced sit within a range and are not exact data points.
In the case of larger courses, this leads to minor variations in percentage to a degree of around one per cent. However, due to this restriction precise grade percentages cannot be accurately calculated for courses with smaller cohorts.
In total since 2020/21 the university has awarded 10,887 firsts, 18,513 2:1s, 3,404 2:2s, 308 3rds, <5 aegrotats (in cases of death, severe illness, or other debilitating condition), and 170 ordinary degrees (in cases of only 300-359 unit credits being awarded).
This totals to 32.7% of students achieving a first, 55.6% receiving a 2:1, and 10.2% a 2:2.
Featured image: Epigram / Ella Blanshard